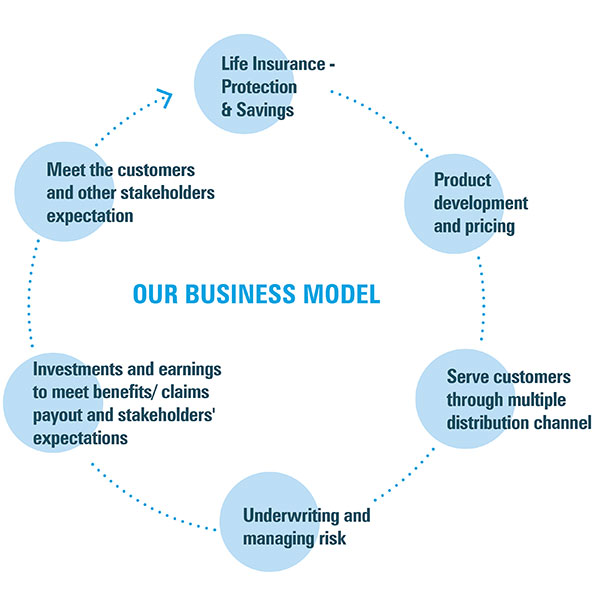
Business model
Our value creation paradigm
INPUTS


MANUFACTURED CAPITAL
Capex for new offices, branches
`0.08 billion
Land and Buildings
`3.72 billion
Furniture and equipment
`1.50 billion
Number of offices
908


HUMAN CAPITAL
Spends towards employee training
`0.09 billion
Training hours in the year
375,348

SOCIAL AND RELATIONSHIP CAPITAL
No. of new policies issued in
rural areas : 362,377 policies;
Premium:
`16.07 billion
No. of new policies issued in
social sector : 1,264 policies
Premium:
`0.09 billion
CSR spends
`0.19 billion
OUR VISION, MISSION, VALUES, PHILOSOPHY AND ETHICS Read More
MULTI-CHANNEL DISTRIBUTION
123,613
Individual agents
58,995
CIFs
22,000+
SBI branches
OUR EXTERNAL ENVIRONMENT
- Rising share of financial savings
- Under-penetration of life insurance in India
- Growing pie of middle-class, working population
- Focus on driving digitalisation
OUR STRATEGIC OBJECTIVES
SO1
GEOGRAPHICAL EXPANSION BY LEVERAGING STRONG DISTRIBUTION CHANNELS
SO2
EMBEDDED COST DISCIPLINE ENSURING PROFITABLE GROWTH
SO3
CUSTOMER FIRST APPROACH
SO4
DIGITAL TRANSFORMATION
SO5
ENHANCED TRAINING
OUTPUTS
FINANCIAL CAPITAL
Gross Premium Income
`329.89 billion
Profit After Tax
`13.27 billion
ROE
18.8%
Net Worth
`75.76 billion
Dividend
Payout
20%
MANUFACTURED CAPITAL
Policies Issued
1.53 million
Reduction in Grievances
From 47 to 27 per 10,000 policies
issued as compared to FY 18
INTELLECTUAL CAPITAL
New products approved
2
Renewal premium collection through
digital mode
64%
Increase in policies through web
aggregators and web sales
44%
HUMAN CAPITAL
Revenue generated per employee
`0.02 billion
Attrition rate
19.6%
Average number of years spent by an
employee in the company
4.5
SOCIAL AND RELATIONSHIP CAPITAL
Lives covered
24 million
Beneficiaries from CSR
Rural Development
5,000+ villages
Disaster Relief
20,000+ people
CSR partners
100+
Business
Partners
184,644
(Banks, Agents,
Broker, CIFs
and Specified
Persons)
OUTCOMES
FINANCIAL CAPITAL
- Financial stability
- Robust cash flows and profitability
- Superior value for shareholders
MANUFACTURED CAPITAL
- A large, superior distribution network
- Diverse, innovative products and services
- High value created for customers
INTELLECTUAL CAPITAL
- Strong response to new launches
- Healthy traction on digital platforms
HUMAN CAPITAL
- Strong employer brand equity
- Committed and highly motivated people
- Healthy retention levels
SOCIAL AND RELATIONSHIP CAPITAL
Long-lasting, trusted relationships with communities, customers and stakeholders