KEY PERFORMANCE INDICATORS
ON A STEADY MOMENTUM TOWARDS,ROBUST FUNDAMENTALS
DELIVERING ROBUST FINANCIALS
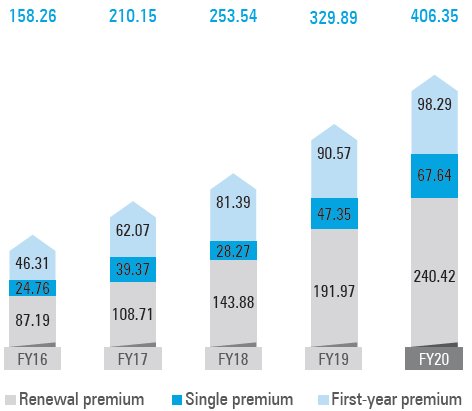
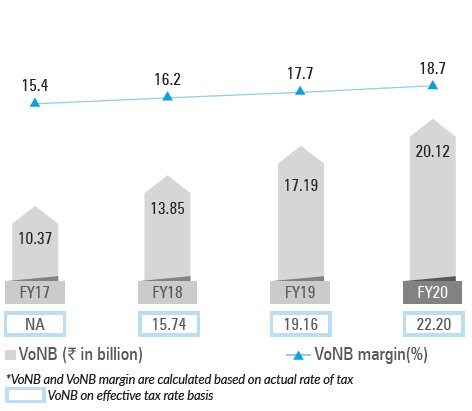
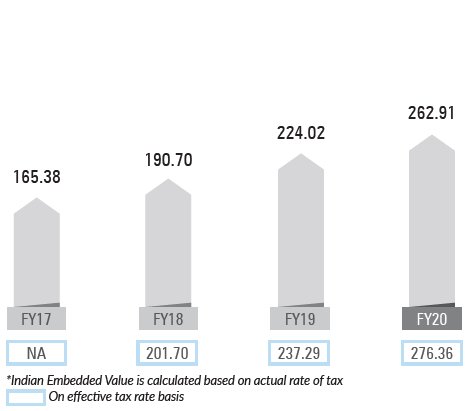
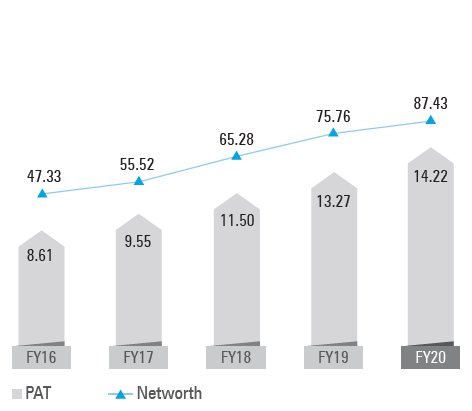
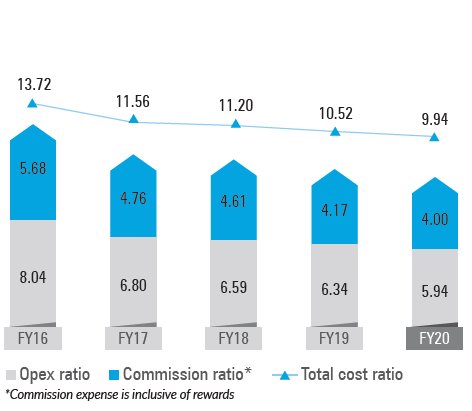
During FY20, we achieved stable and sustainable business growth, ramped up share of the high-margin protection business while maintaining cost ratios and improving persistency. Growth in premiums was driven by the continued traction in the protection as well as the savings businesses. A healthy addition of new policies aided expansion in VoNB and VoNB margin. The increase in networth and new business resulted in a rise in embedded value. However, the sharp sell-off in equity markets in March 2020 due to the pandemic outbreak led to a reduction in our solvency ratio.

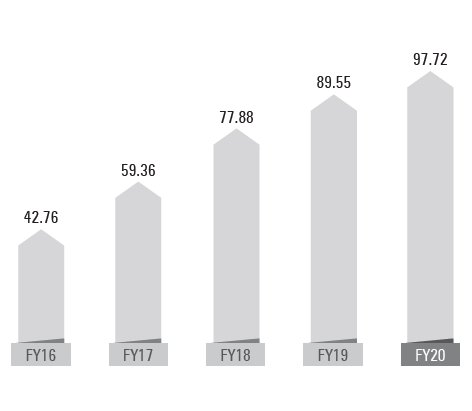
Gross Written Premium (GWP) (` in billion)
New Business Premium (NBP) (` in billion)
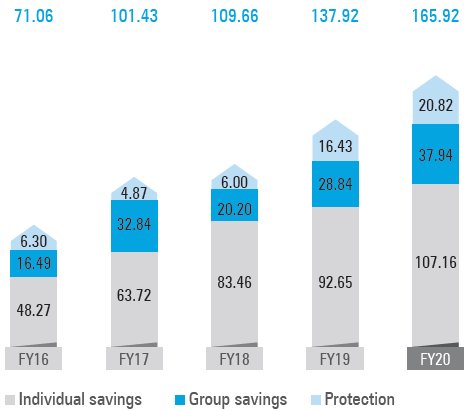
New business APE (` in billion)
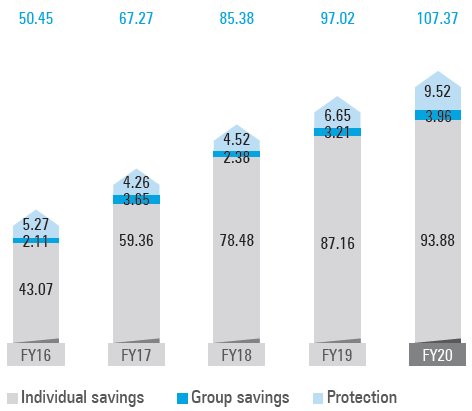
Individual Rated Premium (IRP) (` in billion)
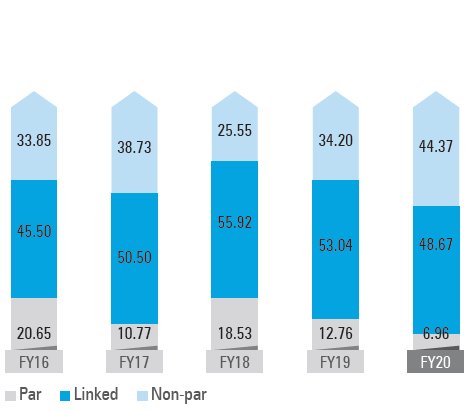
NBP – Product mix (%)
VoNB and VoNB margin
Indian Embedded Value (IEV)* (` in billion)
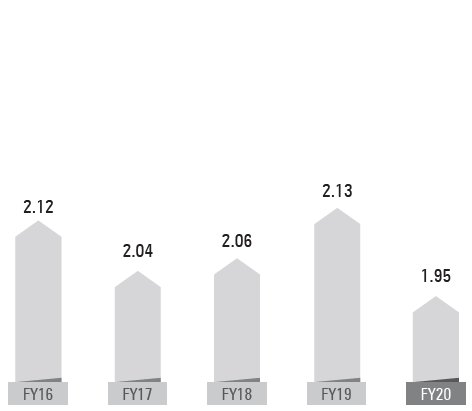
Solvency ratio
PAT and networth (` in billion)
Cost ratios (%)
AUM (` in billion)
CONSOLIDATING MARKET LEADERSHIP
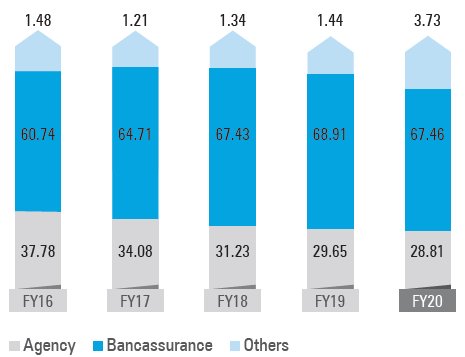
The rapid expansion in our distribution network, our ability to provide products and solutions relevant to our customers’ needs and healthy momentum across most distribution channels have enabled us to maintain our industry leadership (in terms of IRP and individual NBP). We continued to increase our market share in FY20 as well. We maintained the contribution of bancassurance and agency channels while growing the share of the online channel significantly.

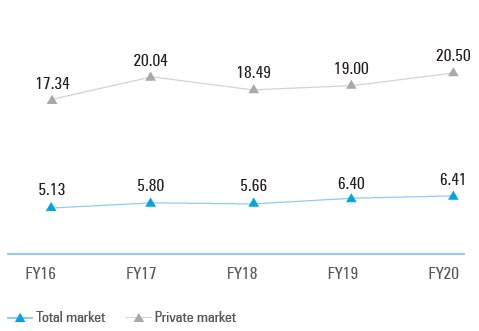
New Business Premium – market share (%)
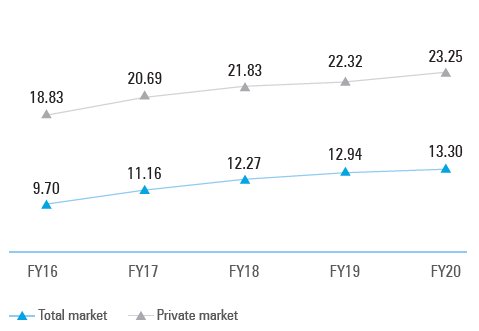
Individual Rated Premium – market share (%)
Individual New Business Premium – channel mix (%)
DRIVING STAKEHOLDER VALUE
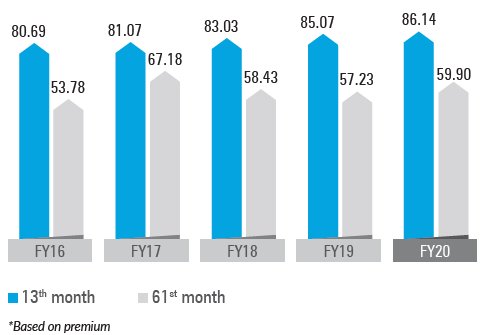
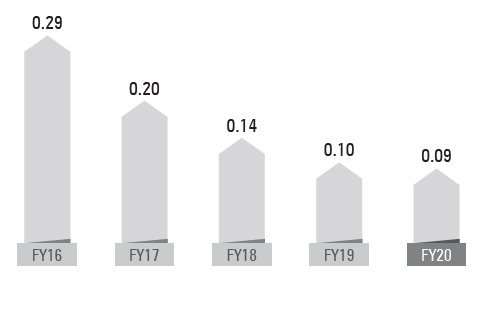
Our persistency ratios across different timeframes have improved. We strictly adhere to fair and ethical business practices, such that our mis-selling ratio is one of the lowest in the industry. We continued to work with our communities to develop programmes and ensure focused spending directed at their overall well-being. We also engaged with our employees in multiple forms and through various modes, which boosted overall productivity. Our digital platforms were strengthened further, leading to higher efficiency across processes and creating higher value for key stakeholders.

Persistency ratio* (%)
Unfair business practices (As a % of total policies)
CSR spend (` in billion)
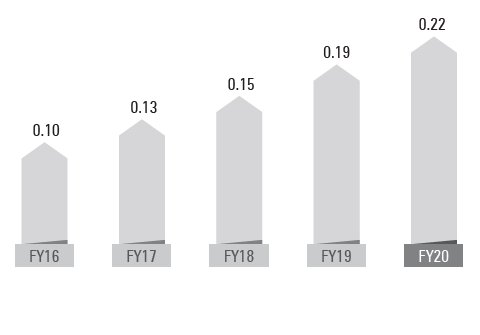
Sales employee training coverage (%)