Key performance indicators
Maintaining healthy momentum
INCOME
Gross Written Premium (` billion)
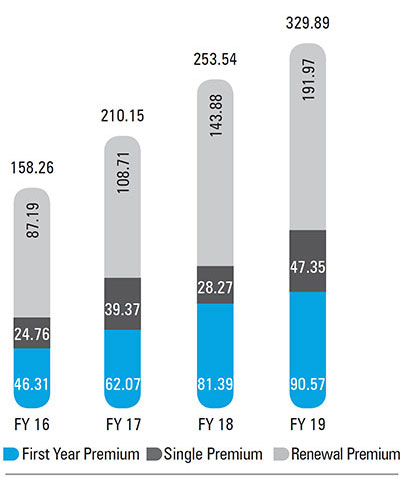
New Business Premium (` billion)
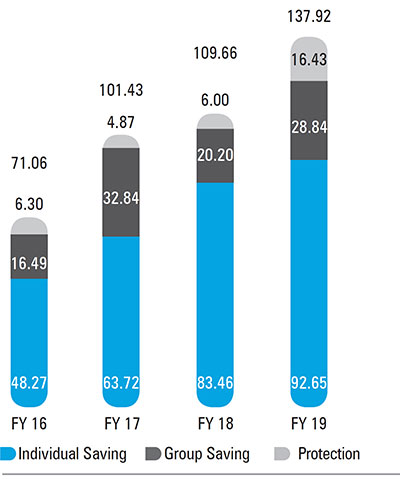
New Business APE (` billion)
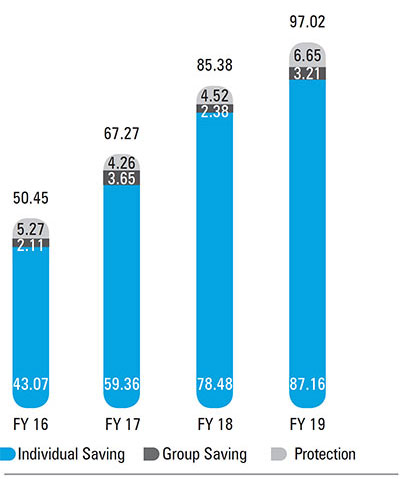
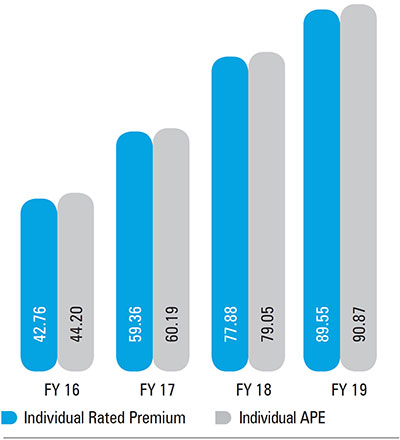
Individual Rated Premium (IRP) and
Individual APE (` billion)
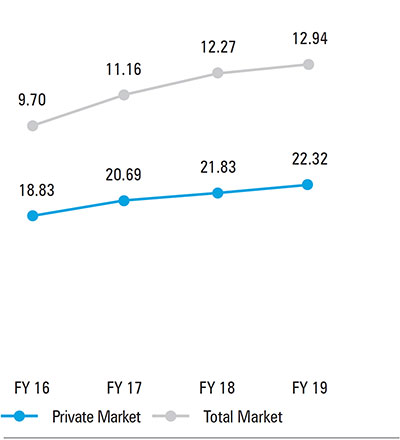
New Business Premium
Market Share (%)
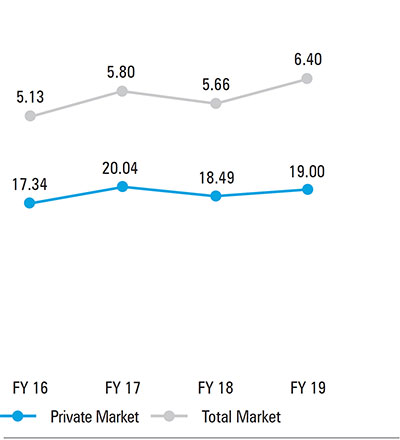
Individual Rated Premium
Market Share (%)
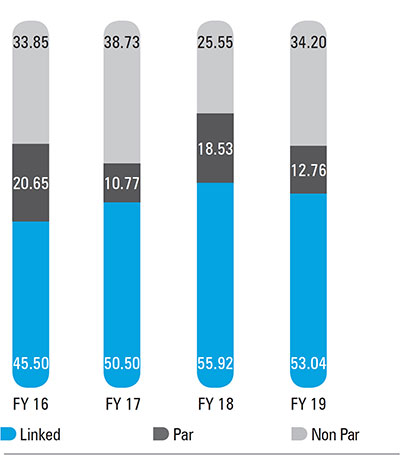
New Business Premium –
Product Mix (%)
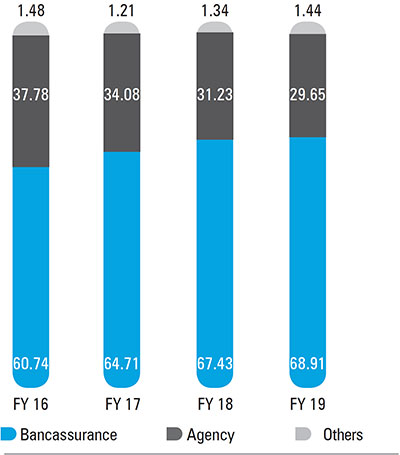
Individual New Business Premium –
Channel Mix (%)
PROFITABILITY
VoNB and VoNB Margin*
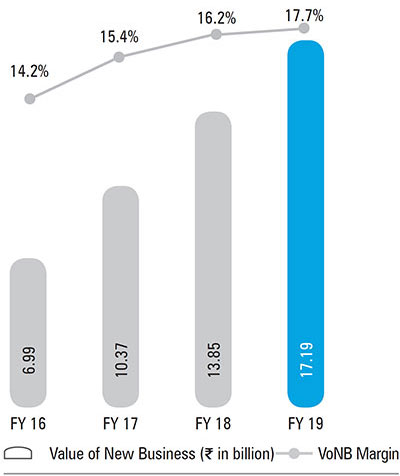
* FY 16 numbers are calculated internally based on MCEV methodology VoNB, VoNB Margin and Embedded Value are calculated based on actual rate of tax
VALUE OF LIFE INSURANCE COMPANY
Indian Embedded Value*(` billion)
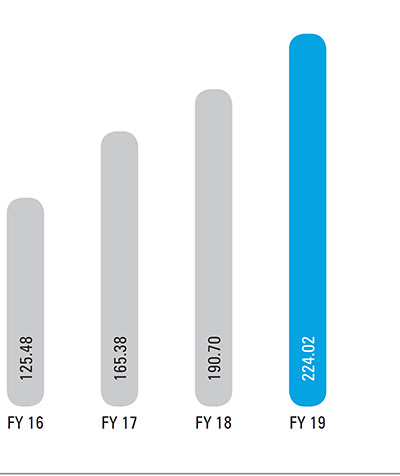
* FY 16 numbers are calculated internally based on MCEV methodology VoNB, VoNB Margin and Embedded Value are calculated based on actual rate of tax
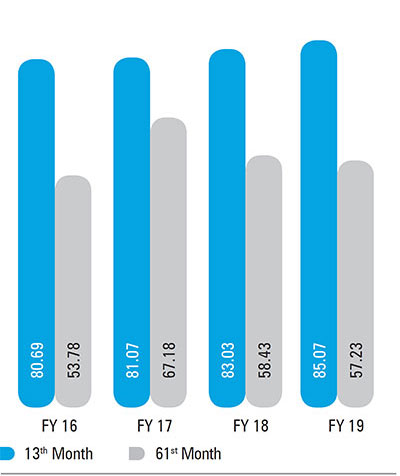
QUALITY OF BUSINESS
Persistency Ratio (%)
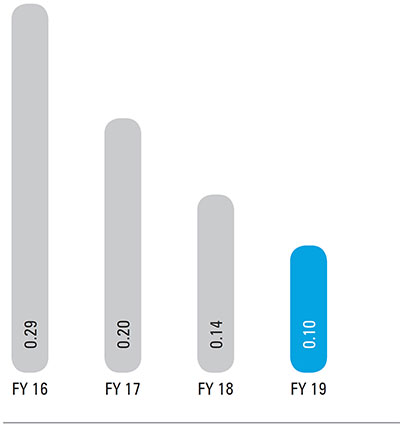
CUSTOMER SERVICE
Unfair Business Practice (%)
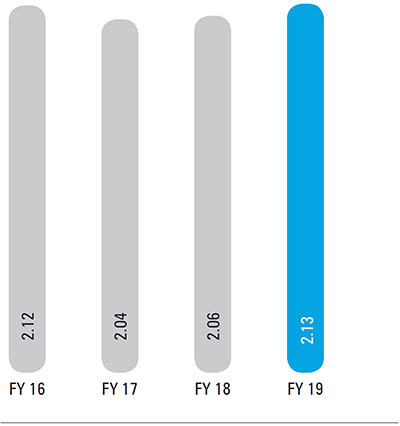
SOLVENCY
Solvency Ratio (%)
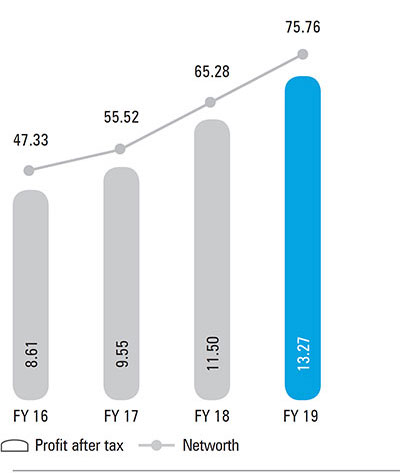
OTHER FINANCIAL PARAMETERS
Profit and Networth (` billion)
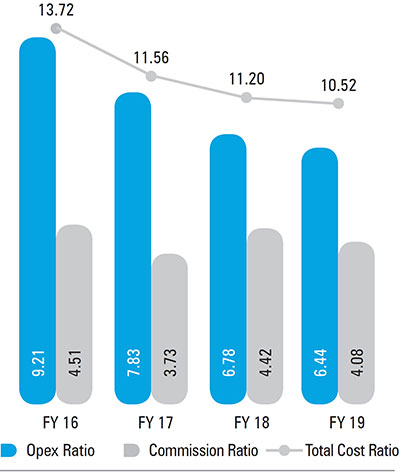
Cost Ratios (%)
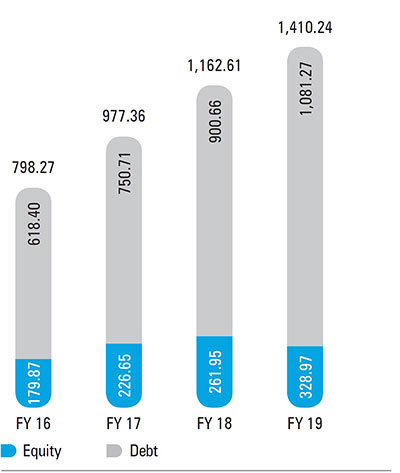
Assets Under Management (` billion)